This post covers how I understand and use the value measures on key British surveys to create value positions and value maps of the British electorate - it is really for new followers and subscribers who haven’t come across the idea before. It draws on this piece from a couple of years ago and sets out a bit more clearly how I make the 9 groups from the data.
How do we define values? Values represent ‘core conceptions of the desirable’. They are not beliefs about what is but rather desires about what ought to be – not a diagnosis of society’s ills but rather a picture of what a healthy society should look like. Values are more permanent than attitudes, more akin to broad musical tastes than to a like or dislike of a particular piece of music and they are ‘latent’, they cannot be directly measured by simply asking people what values they hold.
Values influence behaviour within contexts but also transcend specific situations or moments: our idea of what is a desirable goal does not depend on current circumstances. In the political sphere this means that the kind of society we want to see does not change in response to the particular context in a given election, and whether we value tolerance of the unconventional or the protection of traditional ways of life doesn’t change when a new party leader is elected.
Values guide the evaluation of behaviour and events; this is a function of values that is especially important in a period of waning party loyalty.
Values are ordered according to relative importance – what in the study of public opinion might be termed ‘salience’. Though all values represent desirable outcomes, they are not all equally important to a person. In this way the context of political behaviour matters as well as the value positions of the public.
Beyond left and right
It is still commonplace to talk of the left and right of British politics as if this were a single dimension along which voters and parties could be aligned. But the multi-dimensionality of the political positions of voters had been recognised by academics for a long time, (at least) two dimensions are needed to capture the political values of the electorates of western democracies – one which captures the orientation of the electorate to issues around state intervention in the economic sphere and another which is related to ‘social’ issues. Much of British political debate in the last decade has been a tussle between these different values.
The ‘new’ social values divide is often contrasted with the ‘old’ politics of class, with the ‘new’ dimension variously framed as ‘liberal-authoritarian’ , ‘post-materialist’ , ‘Gal-Tan’, and ‘cultural’; this ‘new’ politics dimension is also often further associated with xenophobic and nativist positions. Some have even taken this as ‘the’ values divide but our economic positions are values too.
Newly salient issues of immigration, sovereignty and political trust are all elements which connect to this social values dimension. Nonetheless, economic divides did not simply disappear and continue to structure voting behaviour alongside new issue divides.
Rather than trying to adjudicate between the economic and the social, we need to understand that it is the way in which they combine that creates some of the key tensions for voters.
Measuring Political Values in the British electorate
Since it began in 2014, one of the most used sources of data for understanding the values of the British public is the British Election Study Internet Panel (BESIP). This study has followed a panel of the British electorate at regular intervals and provides valuable core data for understanding voting dynamics across four general elections. The study includes questions designed to measure the value dimensions described above; an ‘old’ politics dimension concerned with economic justice, the distribution of resources and economic power, which is commonly called the ‘left-right’ dimension and a dimension concerned with ‘personal and political freedom…equality, tolerance of minorities…’ and criminal justice, which has most commonly been labelled the ‘libertarian-authoritarian’ dimension. Exactly how this dimension should be labelled is a source of lively debate. The measures included in the BESIP scale capture elements of attitudes to authority and liberty rather than issues relating to the environment, personal morality, or the tolerance of particular groups, and so I label this scale ‘liberal-authoritarian’ to reflect this.
These two value dimensions are thought of in theoretical terms as being uncorrelated with each other. This means that it is not possible to predict where a voter is positioned on the ‘liberal-authoritarian’ dimension by knowing their position on the ‘left-right’ dimension; more simply just because someone supports renationalising the railways does not necessarily mean they will also be against the reintroduction of the death penalty.
The two value scales are each measured using five statements, the respondents are asked whether they agree or disagree with each item on a five-point scale from strongly agree to strongly disagree.
Attitudinal items for the left-right scale are:
· Government should redistribute income from the better off to those who are less well off
· Big business benefits owners at the expense of workers
· Ordinary working people do not get their fair share of the nation's wealth
· There is one law for the rich and one for the poor
· Management will always try to get the better of employees if it gets the chance
Attitudinal items for the liberal-authoritarian scale are:
· Young people don't have enough respect for traditional values
· Censorship is necessary to uphold moral values
· For some crimes, the death penalty is the most appropriate sentence
· Schools should teach children to obey authority
· People who break the law should be given stiffer sentences
The scales are created to run from 0 through to 10 and so that low values represent the ‘left’ and ‘liberal’ ends of the scales, respectively.
A long-standing feature of the British electorate is that, using these measures of values, the average voter is located to the ‘left’ on the economic dimension and to the ‘authoritarian’ end of the social dimension, or as many commentators now put it ‘left on economics, right on culture’. While a focus on the absolute position is helpful for assessing how the average voter has changed over time, it is important not to get too hung up on these absolute measures as the precise items used in the scales can change these positions.
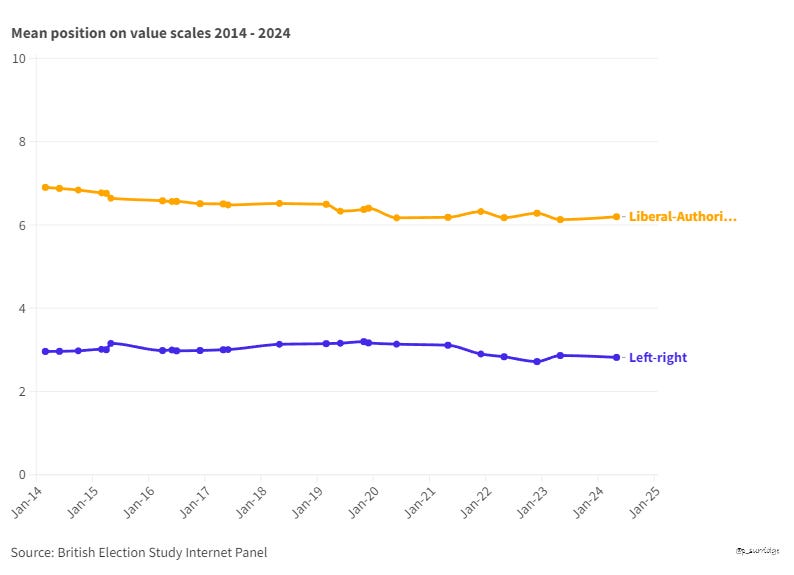
Using the data from the BESIP from wave 1 through to the most recent wave post the 2024 election we can see how the values of the British public have changed (on average) over this period.
We would not expect value change to occur quickly, but nonetheless there has been a trend towards more liberal values over the period while left-right position have been more stable.
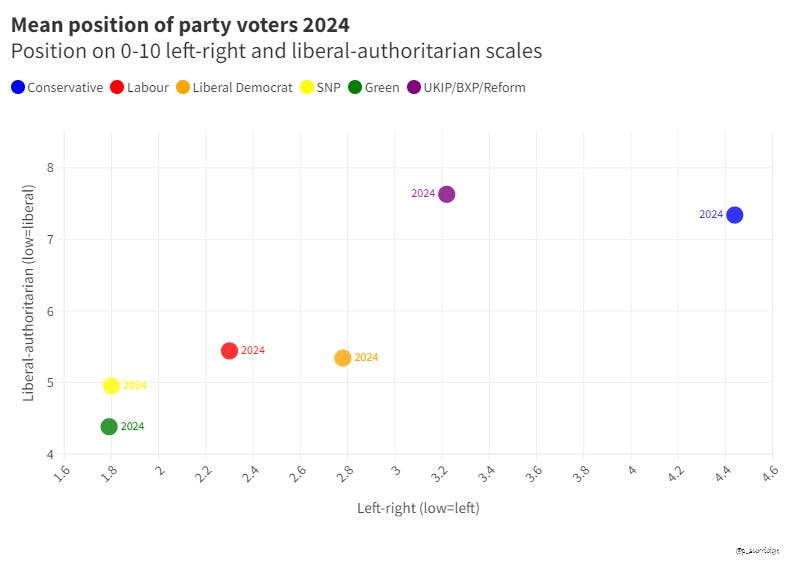
I often use these positions in combination to plot different groups of voters in ‘value space’ - as shown below for the 2024 election.
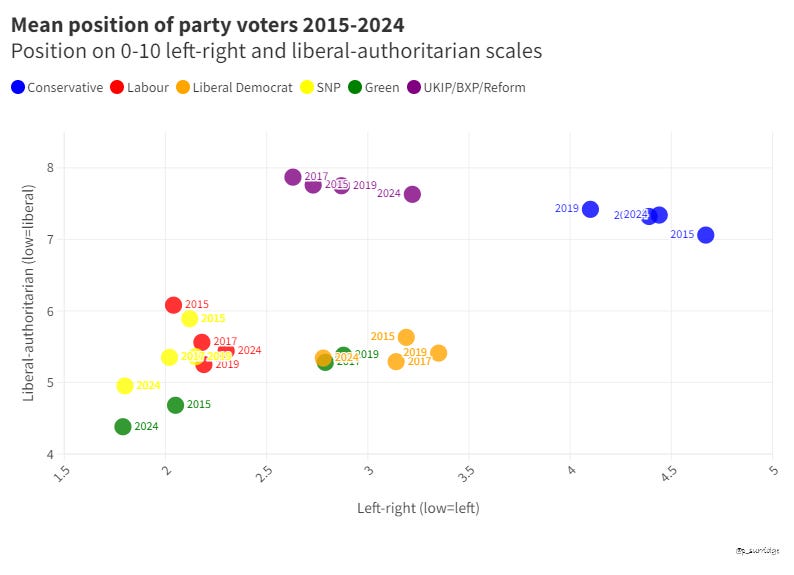
They can also be used to look at how the positions of voters for different parties have changed over time.
Although these are useful ways of thinking about how different groups of voters are positioned in this value space I find it more helpful to cut the space into groups to think about different types of voters as defined by their values. Many polling and research organisations do something similar using varieties of latent class analysis - for example BMG and More in Common each have a voter segmentation of this type. My approach is less complex, it uses only the measures described above and does the grouping based on the theoretical positions of the scales.
To do this I take the 0 - 10 scale and assume a mid-point of 5 (not the mean or median voter position). I then cut each scale into three parts (left, centre and right; liberal, moderate and authoritarian). Cross these groups together produces nine groups in the electorate. The scales are not cut quite equally into theoretical or empirical thirds, I make adjustments for acquiesence bias (all the statements are coded in one direction and there is a small tendency for survey participants to agree with statements when asked) and an adjustment for the distribution of the electorate (the left and authoritarian parts are much larger). So the cut points used are 0 - 2.5 = left 2.6 - 5.0 = centre and 5.5 - 10 = right and 0 - 4.5 = liberal 5.0 - 7 = moderate and 7.5 - 10 = authoritarian.
Of course these are not absolute positions, and are based on my judgement with 30 years of experience as an analyst of values data - similar judgements have to made when deciding how many groups to extract in a latent class analysis, factors in a factor analysis. Data analysis is not as black and white as it is often presented. But I have found these groupings very useful for analysing political behaviour - and they have proved insightful over the last three electoral cycles.
The size of the groups are not equal - the analysis is designed to allow for change in the sizes of the groups over time. Comparing 2014 with 2024 shows there has been some growth in the liberal-left group over this period, reflecting the gradual move to more liberal positions in the electorate. It also highlights that there is a large group of those on the left who do not hold ‘liberal’ positions.
These groupings allow me to produce analysis like this (using data up to May 24 just before the election was announced) - something there will be much more about in the coming weeks on this substack.
This post is only to explain how I use the data on values. For discussions of the trends, many more charts and what they mean for parties please subscribe to this substack or follow me at @psurridge.bsky.social.


